
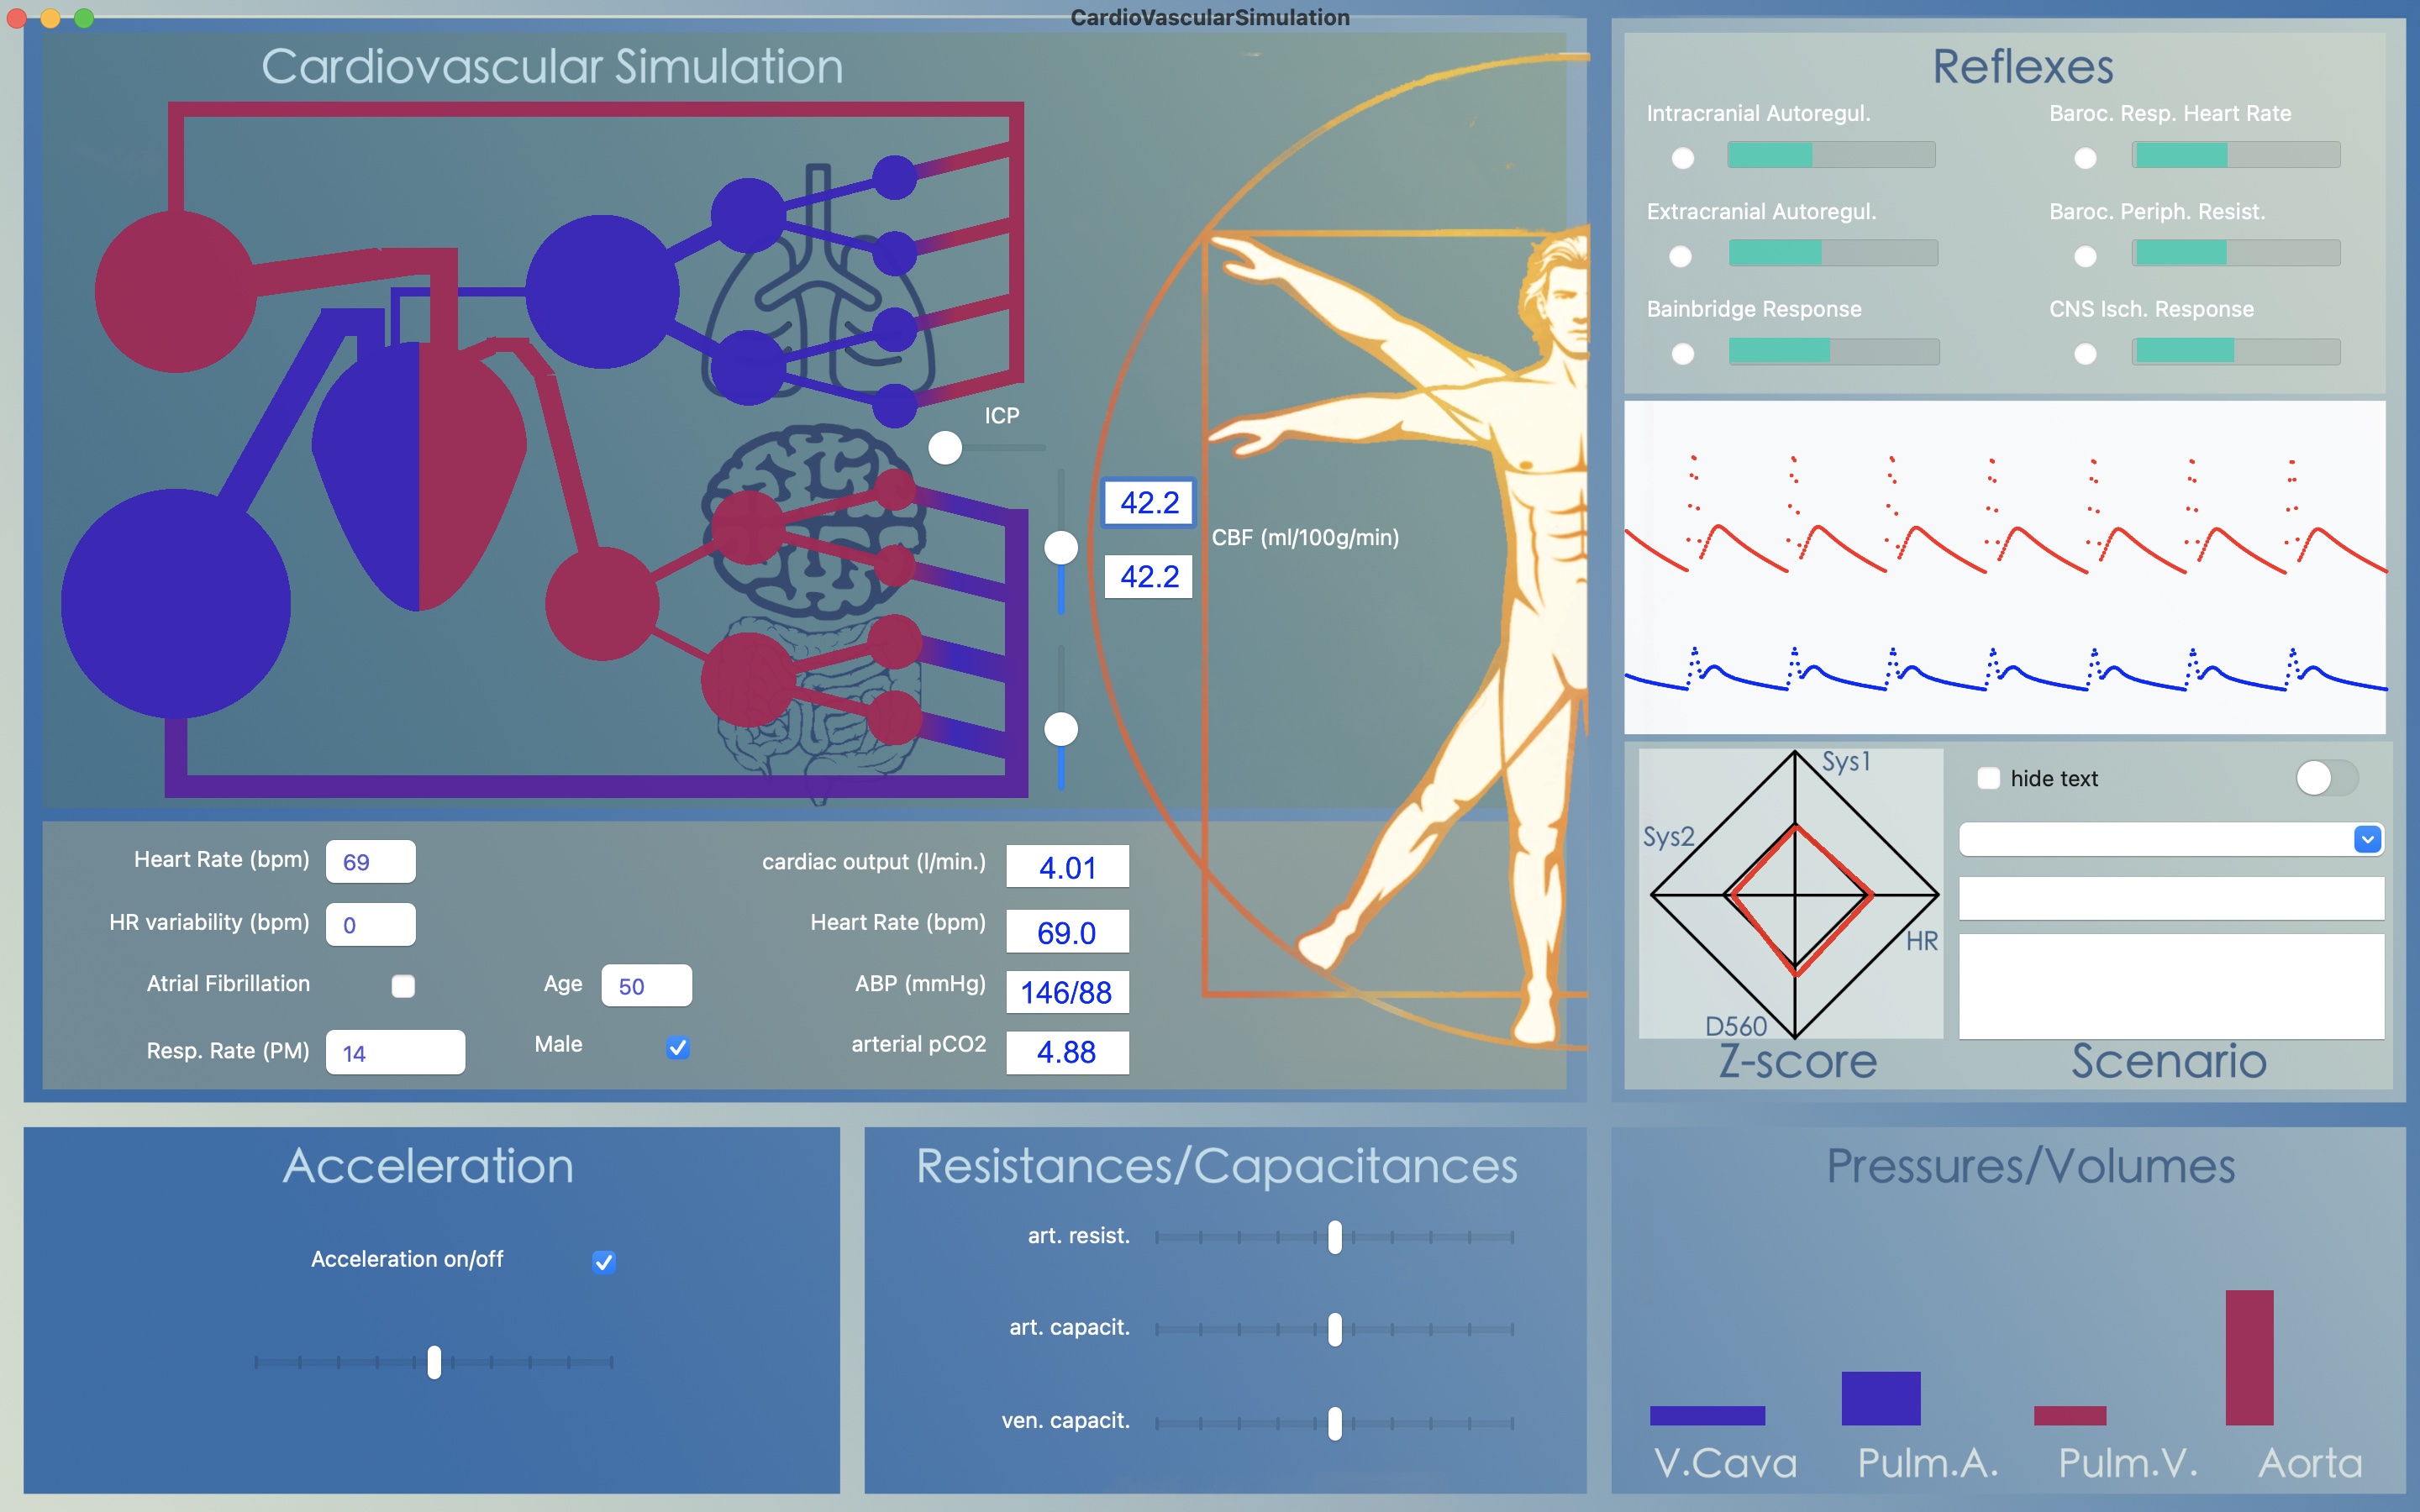

The blood flow velocities measured by TCD are complex signals but can give instantaneous information about cerebral hemodynamics. Neuromon B.V. aims to disclose this information in a meaningful way to physicians for rapid diagnostic and therapeutic purposes. At the beginning of 2018 Neuromon B.V. presented a novel approach for graphical representation of the middle cerebral artery flow velocity. Based upon the improved parameters Z-scores are calculated to correct for age and different variables are combined into a single radar-plot.
A Z-score expresses how many standard deviations a given measurement is above (positive) or below (negative) the value expected for a given age. Z-scores for different parameters can be combined into a radar plot. An example is give to the right: data are provided for average Z-scores during hyperventilation (red), normoventilation (green) and CO2-retention (yellow).
A. Schaafsma, A new method for correcting middle cerebral artery flow velocity for age by calculating Z-scores. Journal of Neuroscience Methods. 307, 1–7 (2018).
The background of this graphical representation is also explained in the following pamflet: TCD-NewParmCoordinates.pdf.
